My Beagle Bone Black Logic-level analyser in a web-application
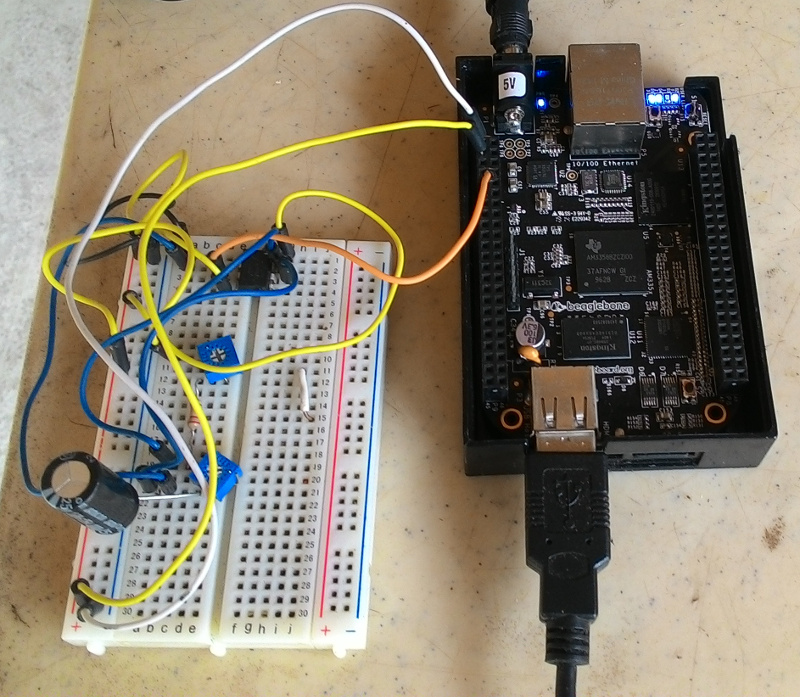
For my aquaponics project I need to create a timed switch that turns my pump on and off. I am doing this with a simple 555 timer in a-stable mode, a capacitor, a relais and two pot-meters. The timer in a-stable mode switches a pin between high and low state, for a fixed amount of time. Both the high and the low times can be adjusted with the potentiometers.
To test if my calculations were right though, I need to monitor the output pin state. I did this already with a small LED, but since the timing is quite long (my pump should be on for 2 minutes and off for 10), I was quite annoyed having to sit looking at an LED for a while and I missed the switching between high and low multiple times. Especially in the beginning it is annoying because the initial startup is twice the “on” state, so even 20 minutes. A lot of time to waste, that I’d rather waste by developing a nice web-application that monitors the pin state in a graph.
And so my logic-level analyser was born. I have a Beagle Bone Black lying around which is perfect for this. It has many digital input/output pins, an Analog-Digital Converter (ADC) and PWM output among other things. I have a wifi card plugged into it as well, so as soon as I switch it on, it joins my wifi. It also contains a node.js server an runs the Cloud9 IDE which allows for easy programming of it, and with the bonescript library makes the many features available in javascript. So what better way to create a logic level analyser by just wiring the output pin of my 555 timer circuit (on a breadboard) to one of the GPIO pins of my beaglebone and plot the state of the pin in a graph in a web-interface.
I wanted to do more with AngularJS anyway and creating dashboards with it, so searching for a nice plotting library wasn’t wasted time anyway. I really like AngularJS the more I play with it, especially it’s way to separate the (interface) logic from the html and it’s ability to dynamically change the data for a “controller” and have it update the interface. Perfect for me where I want to continuously poll the pin state of my beaglebone and update the graph. It can even gracefully handle a lost connection for instance with a wifi hick-up. The angular-nvd3 libary is the library that I chose for the graphs. The underlying graphing library is D3, which is quite powerful, but it includes a much easier/quicker to use JSON-based API, and integrates very well with AngularJS. You can find the code, which is quite self-explanatory on github.
Just to note some of the more interesting points:
- The Beaglebone Black runs node-js which supports web-sockets. It also provides the bonescript Javascript library that can either be used by node-js or run in the browser. In the latter case it connects to the Beaglebone Black through a websocket using socket.io (which needs to be present on the beaglebone in /socket.io/socket.io.js). This is what the
$scope.setupBoneScriptfunction takes care off. The call tosetTargetAddressin there is from the bonescript library. As soon as the websocket connection is established, it calls$scope.refresh, which polls the pin and updates the graph and starts a timeout to repeat itself continuously. - The configuration of the graph is done with the
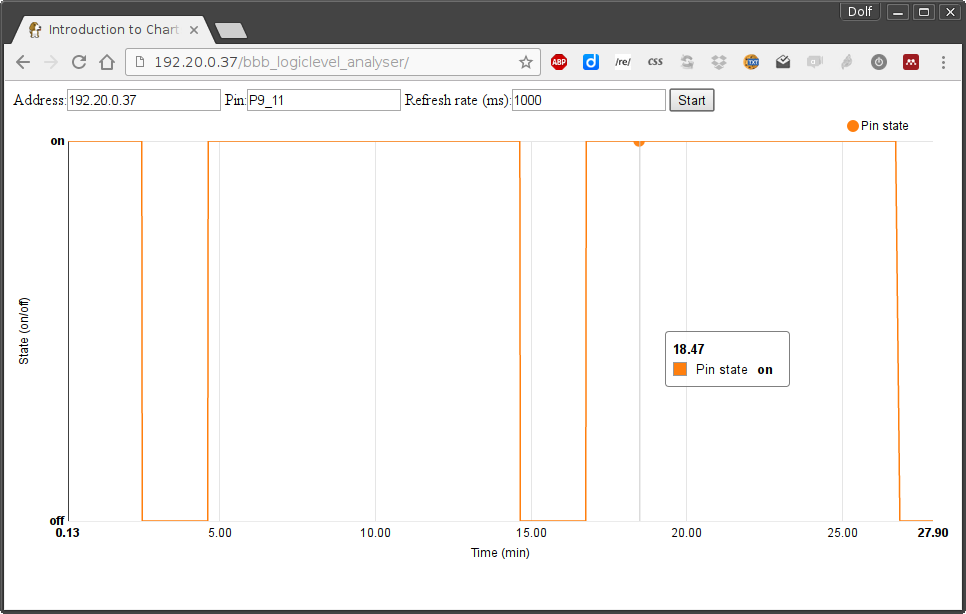
$scope.optionsobject which contains the configuration parameters for the graph. - The graph’s y-axis contains only the values on and off. Bonescript returns 1 and 0 for the pin state though. But the NVD3 graph allows you to change the values displayed on the y-Axis with the
$scope.options.chart.yAxis.tickFormatfunction. This just gets the y-axis value and should return the value that you want displayed on the y-axis. - With ```$scope.options.chart.yDomain: [0,1]`` I forced the y-Axis to only contain values from 0 (off) to 1 (on). Else it would also include -1 on the y-axis.
- with
$scope.options.chart.yAxis.tickValues: [0,1]I made sure that there are only y-axis ticks for the values 0 (off) and 1 (on), and none in between.